Metastatic Response
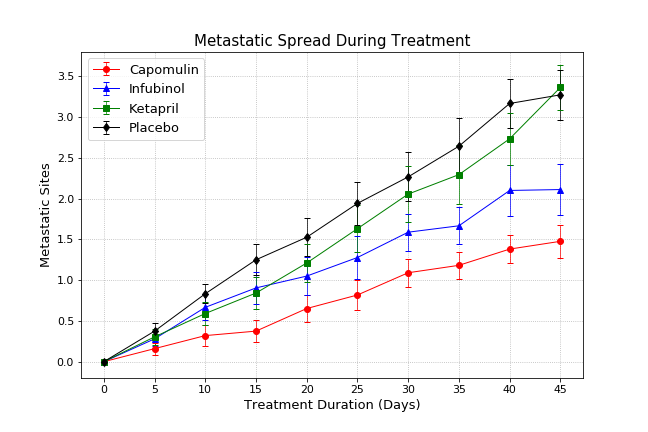
This scatter plot shows how the number of metastatic sites changes over time for each treatment. The 25 mice per drug treatment group have an average of 0.0 metastatic sites when the study starts. In each group, the metastatic sites increase but after 45 days, the average is significantly lower for Capomulin and Infubinol (respectively 1.48 and 2.11 vs 3.27 for Placebo). In conclusion, the Capomulin shows higher efficacy in limiting cancer spreading.
Visualizations